
Where Millennials Are (and Are Not) Buying Homes
Despite a small uptick between mid-2016 and the first quarter of 2018, homeownership in the U.S. has been on the decline since 2005. Prolonged effects from the Great Recession, steep home prices, increasing mortgage rates, and the rise of the millennial demographic have all contributed to a national trend that favors renting over buying.
According to the U.S. Census Bureau, there are approximately 75 million owner-occupied housing units across the U.S. Of these, fewer than 10 percent are owned by millennials, who for the purpose of this study are defined as the demographic between the ages of 15 and 34. For millennial families in particular, later marriage, student loan debt, stagnant wages, and high childcare costs have made it more difficult to buy homes.
As a result, millennials lag previous generations in homeownership even when adjusted for age differences. In 2016, the national homeownership rate for 15-34 year olds was 32.6 percent, compared to 63.6 percent for all ages. This represents an 11.4 percent decrease from just five years prior, compared to a 3.8 percent decrease across all ages—a difference that in part highlights the more significant effect macroeconomic factors are having on the millennial generation than others.
Despite the nationwide trend of low homeownership among millennials, the rates vary significantly from city to city. To see where millennial homeownership is highest and lowest, researchers at online life insurance agency Haven Life used data from the U.S. Census Bureau 2016 American Community Survey to analyze the top 200 cities in the U.S. by population. Here’s what they found:
- The average millennial home value in the U.S. ($204,504) is 23% lower than the average home value across all ages ($264,588).
- There are affordable cities where millennials are buying homes at rates significantly above the national average of 32.6 percent for their demographic. The homeownership rate for millennials in the 25 cities with the highest millennial homeownership rate is 44.0 percent, compared to 12.7 percent for cities with the lowest millennial homeownership rate.
- Low-millennial-homeownership cities tend to be more expensive than their counterparts. The average millennial home value in the 25 low-millennial-homeownership cities is $493,314, compared to $199,915 for the 25 high-millennial-homeownership cities.
- Homeownership rates in the low-millennial-homeownership cities fell more over the past five years (-16.9 percent) than those in the high-millennial-homeownership cities (-7.5 percent).
- Most high-millennial-homeownership cities are in the Midwest, while almost all cities with low homeownership rates are coastal.
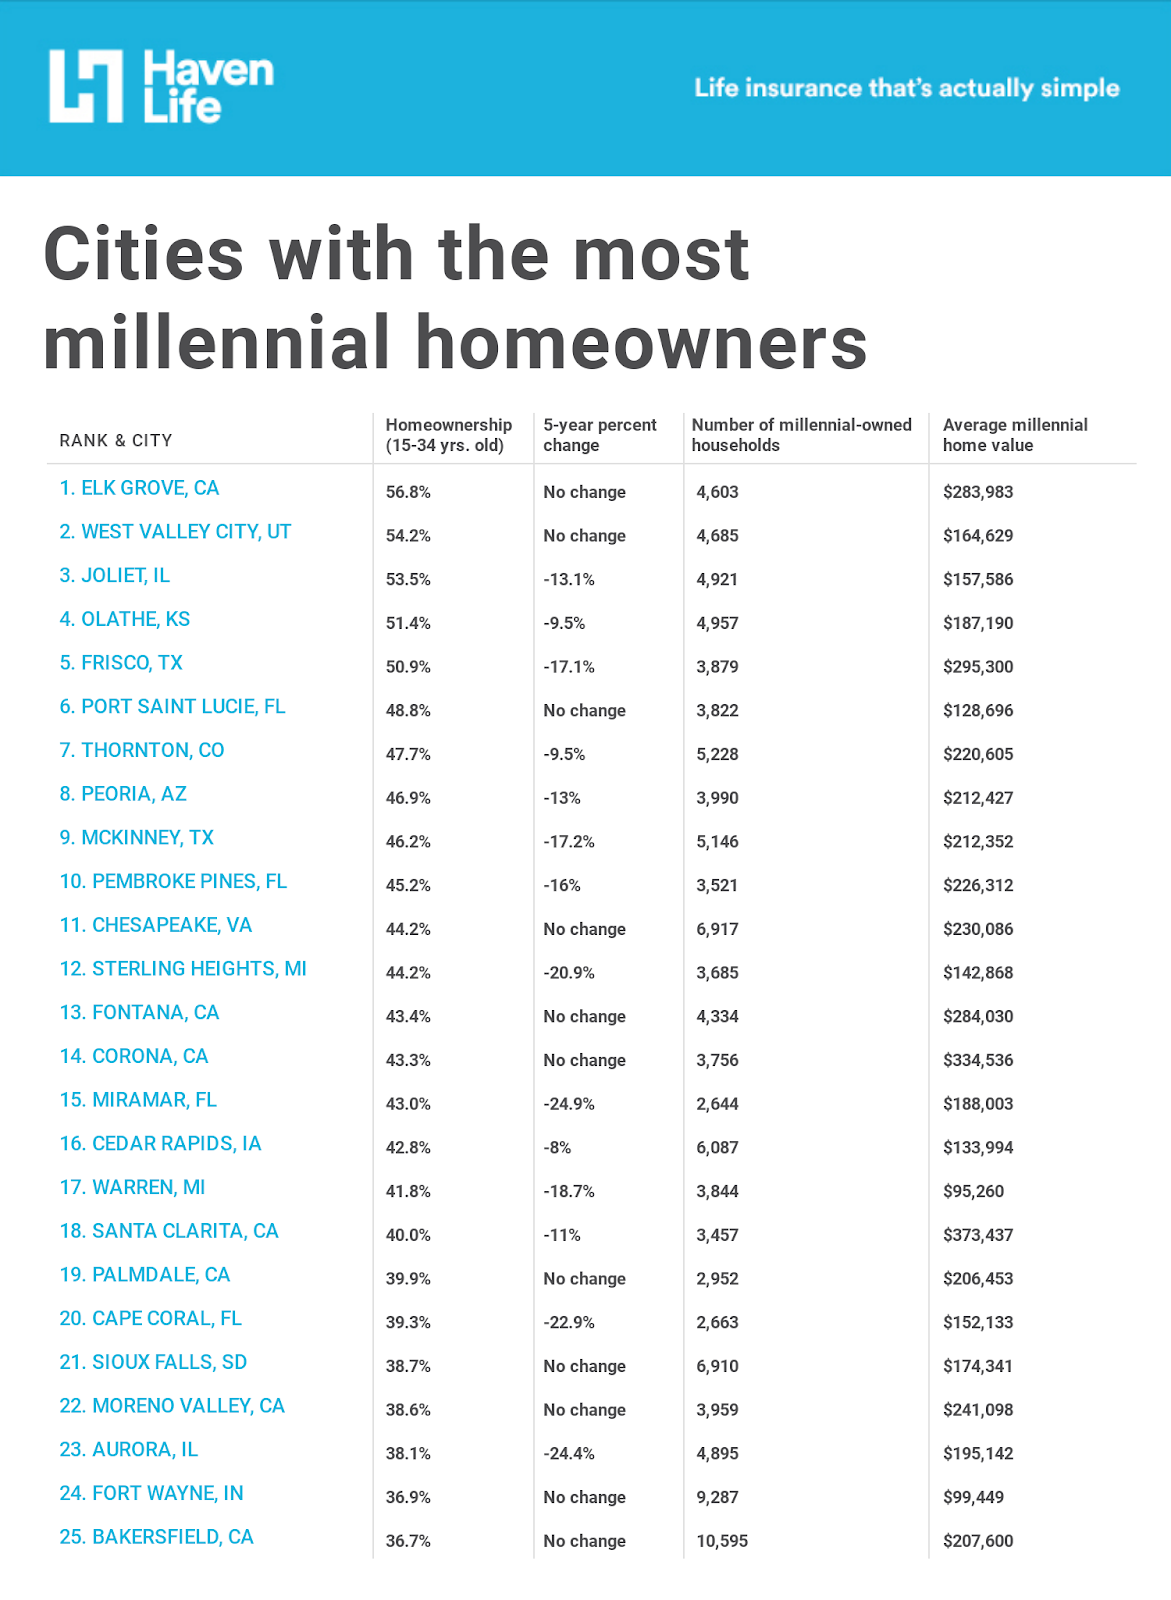
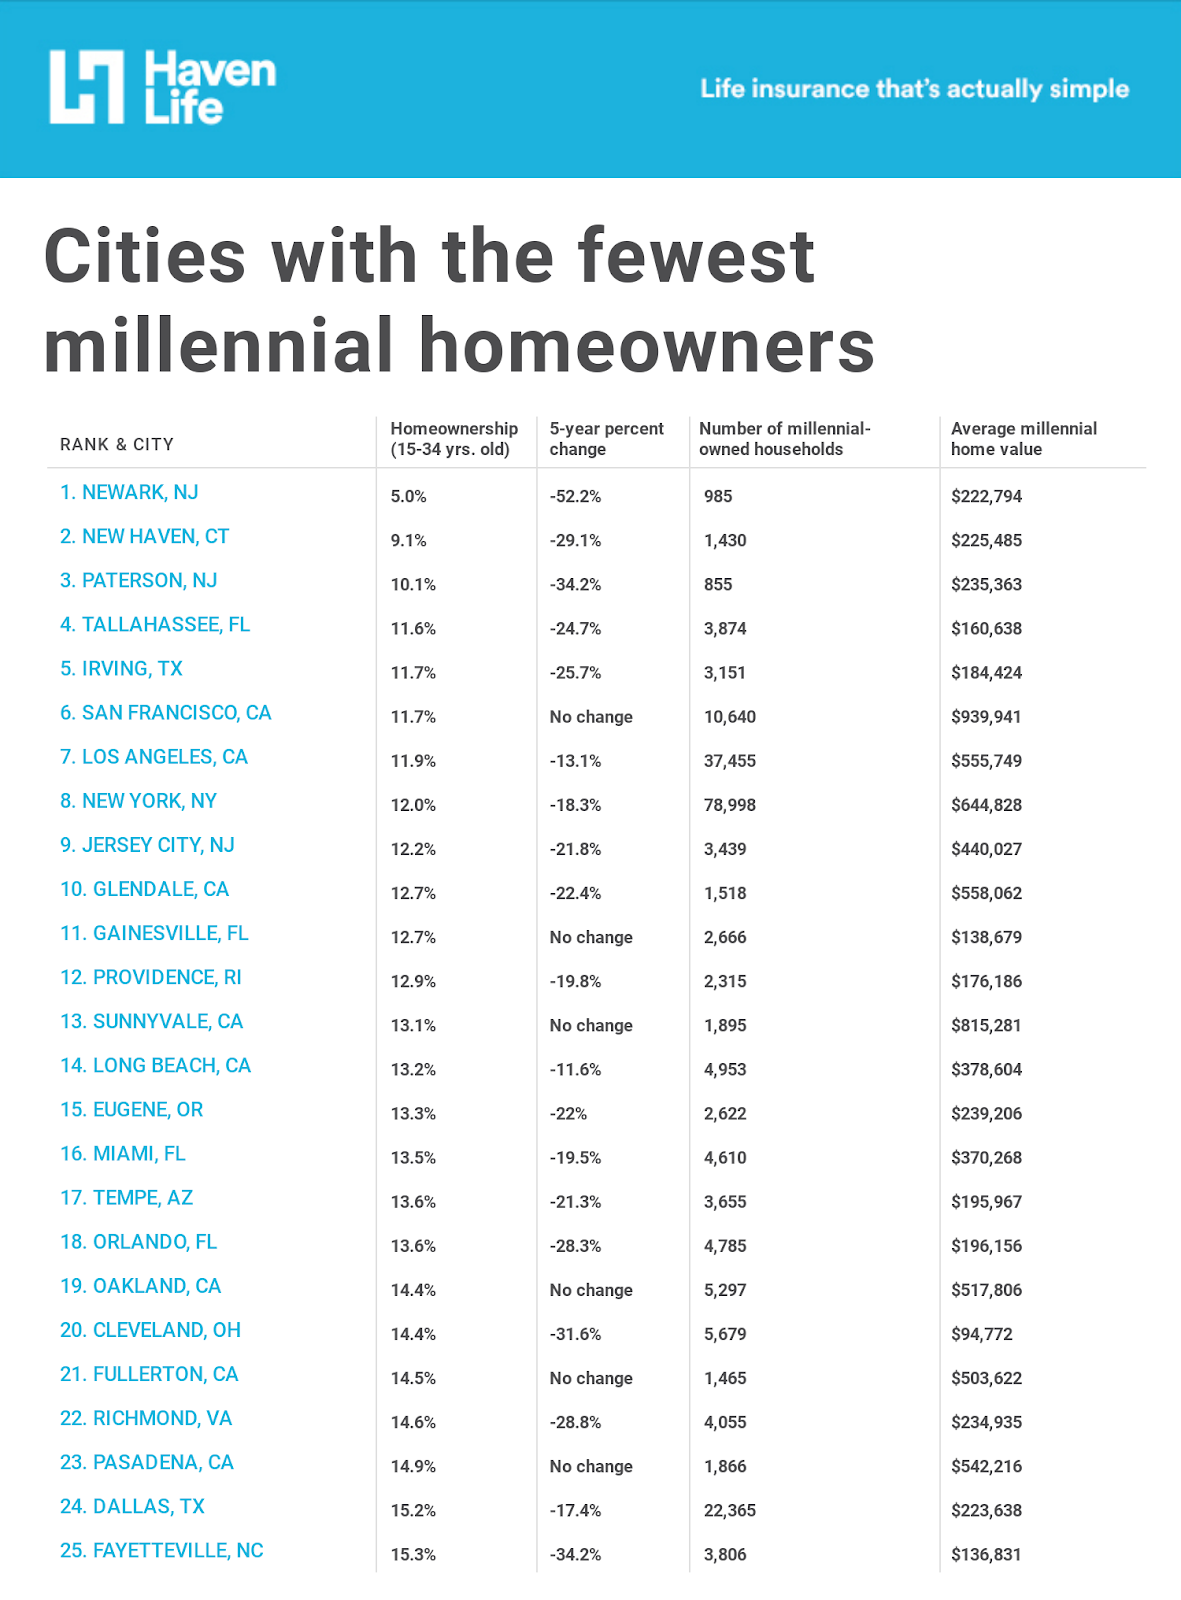
Despite attracting large millennial populations, many of the most populous U.S. cities have some of the lowest millennial homeownership rates. To show just how challenging it’s been for millennial families to buy in the nation’s urban centers, Haven Life’s researchers also included statistics on the largest 25 cities in the U.S. From a low of 11.7 percent in San Francisco, to a high of 32.5 percent in Fort Worth, all of the largest cities have a millennial homeownership rate that’s below the national average of 32.6 percent.
Low millennial homeownership rates in the largest U.S. cities
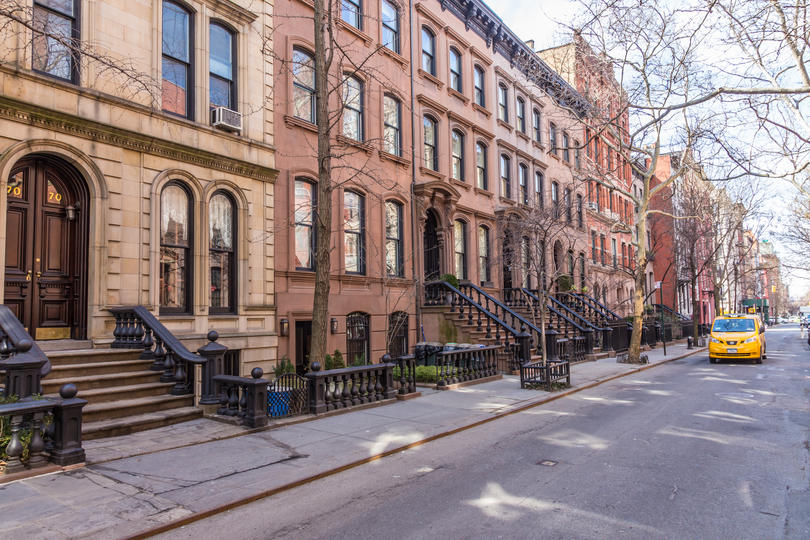
Photo Credit: Matej Kastelic / Alamy Stock Photo
1. New York, NY
- Homeownership rate (15 to 34 years old): 12.0%
- 5-year percent change: -18.3%
- Homeownership rate (all ages): 32.0%
- Millennial-owned households: 78,998 (out of 1,000,242 owner-occupied households)
- Average millennial home value: $644,828
- Average home value (all ages): $699,485
With its famously expensive housing market, New York City has one of the lowest rates of millennial homeownership in the U.S. Only 12 percent of millennials own a home in New York City, compared to 32.6 percent across the U.S. This represents a 18.3 percent decline in homeownership for 15-34 year olds from 2011. The average millennial home value of $644,828 (second-highest on the list) is also significantly higher than the $204,504 national average of millennial homes, which contributes to the low homeownership rate.
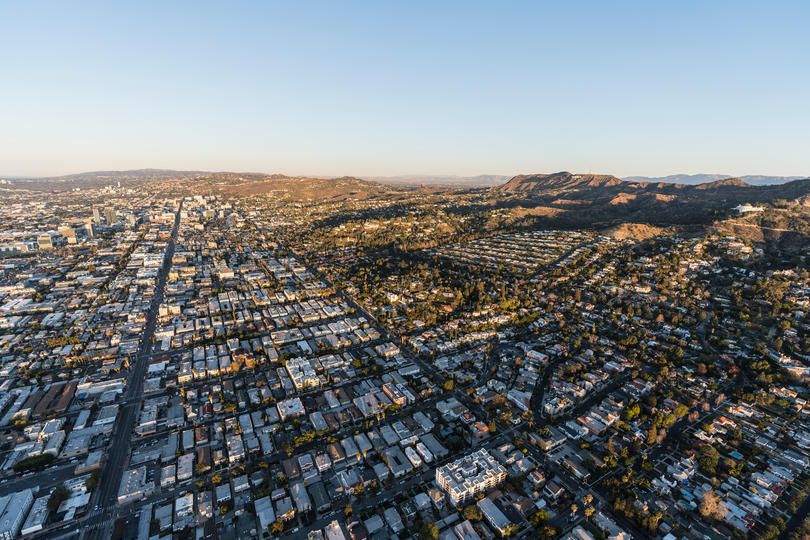
Photo Credit: trekandshoot / Alamy Stock Photo
2. Los Angeles, CA
- Homeownership rate (15 to 34 years old): 11.9%
- 5-year percent change: -13.1%
- Homeownership rate (all ages): 36.6%
- Millennial-owned households: 37,455 (out of 496,667 owner-occupied households)
- Average millennial home value: $555,749
- Average home value (all ages): $691,863
At 11.9 percent, Los Angeles has the second-lowest homeownership rate on this list, just behind San Francisco. Only 37,455 households out of almost half a million are owned by millennials. The average home value for millennials is $555,749, much higher than the national average but still significantly less than the overall average Los Angeles home value of $691,863.
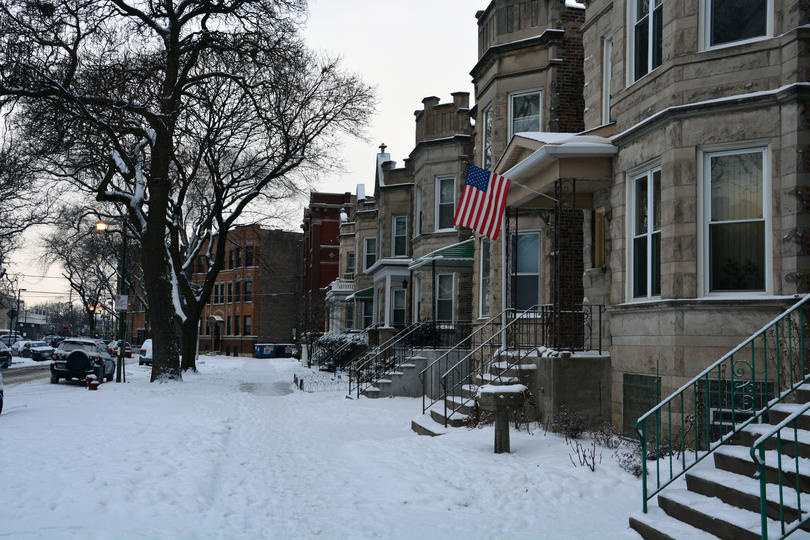
Photo Credit: D Guest Smith / Alamy Stock Photo
3. Chicago, IL
- Homeownership rate (15 to 34 years old): 19.5%
- 5-year percent change: -21%
- Homeownership rate (all ages): 44.1%
- Millennial-owned households: 56,155 (out of 459,889 owner-occupied households)
- Average millennial home value: $297,416
- Average home value (all ages): $301,115
In Chicago, 56,155 homes are owned by millennials. The millennial homeownership rate is 19.5 percent, while the overall homeownership rate is 44.1 percent. The average millennial home value is $297,416, which is just below the city’s overall average home value of $301,115.
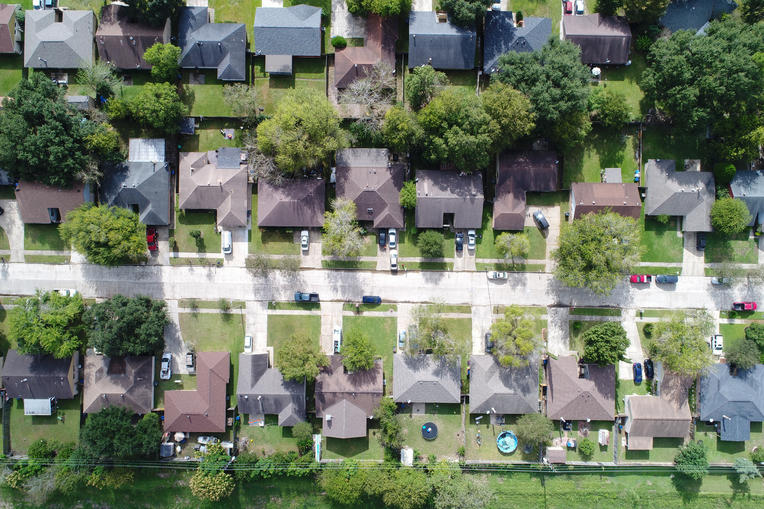
Photo Credit: Duy Do / Alamy Stock Photo
4. Houston, TX
- Homeownership rate (15 to 34 years old): 16.6%
- 5-year percent change: -16.3%
- Homeownership rate (all ages): 43.2%
- Millennial-owned households: 38,574 (out of 359,118 owner-occupied households)
- Average millennial home value: $224,546
- Average home value (all ages): $241,674
In Houston, the millennial homeownership rate is 16.6 percent, much lower than some of the other large cities in Texas like El Paso and Fort Worth. This rate has decreased 16.3 percent since 2011, which is greater than the national average decrease of 11.4 percent over the same time period. The average millennial home value is $224,546, which is slightly higher than the national average.
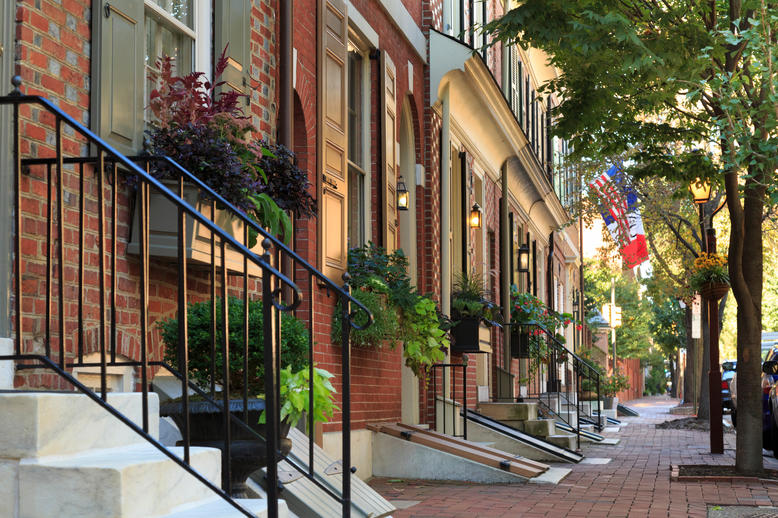
Photo Credit: Jon Lovette / Alamy Stock Photo
5. Philadelphia, PA
- Homeownership rate (15 to 34 years old): 23.5%
- 5-year percent change: -14%
- Homeownership rate (all ages): 52.4%
- Millennial-owned households: 33,165 (out of 305,214 owner-occupied households)
- Average millennial home value: $196,876
- Average home value (all ages): $186,330
In Philadelphia, 23.5 percent of millennials own their own homes. This is the highest rate of the Northeast cities on this list. Bucking the trend of millennials buying less expensive homes, Philadelphia’s average millennial home value of $196,876 is higher than the city’s average home values for all ages, which is $186,330.
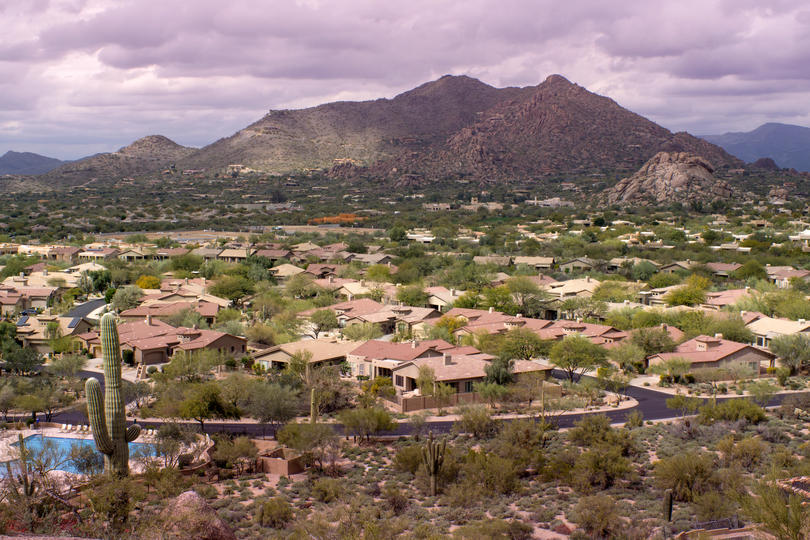
Photo Credit: Paul Hill / Alamy Stock Photo
6. Phoenix, AZ
- Homeownership rate (15 to 34 years old): 27.9%
- 5-year percent change: -14.5%
- Homeownership rate (all ages): 52.7%
- Millennial-owned households: 37,073 (out of 283,740 owner-occupied households)
- Average millennial home value: $187,556
- Average home value (all ages): $236,317
At 27.9 percent, Phoenix has one of the highest millennial homeownership rates on this list, though it is still less than the 32.6 percent millennial homeownership rate nationwide. From 2011 to 2016, the homeownership rate for 15-34 year olds dropped by 14.5 percent. Both millennial home values and average home values for all ages in Phoenix are lower than the national average.

Photo Credit: CrackerClips Stock Media / Alamy Stock Photo
7. San Antonio, TX
- Homeownership rate (15 to 34 years old): 23.0%
- 5-year percent change: -17.1%
- Homeownership rate (all ages): 54.1%
- Millennial-owned households: 27,426 (out of 266,039 owner-occupied households)
- Average millennial home value: $145,165
- Average home value (all ages): $155,135
The millennial homeownership rate in San Antonio is 23 percent. About ten percent of homes in San Antonio (27,426 out of 266,039) are owned by millennials. San Antonio has some of the lowest home values on this list, and there is only a small discrepancy between the average millennial home value ($145,165) and the average home value for all ages ($155,135).
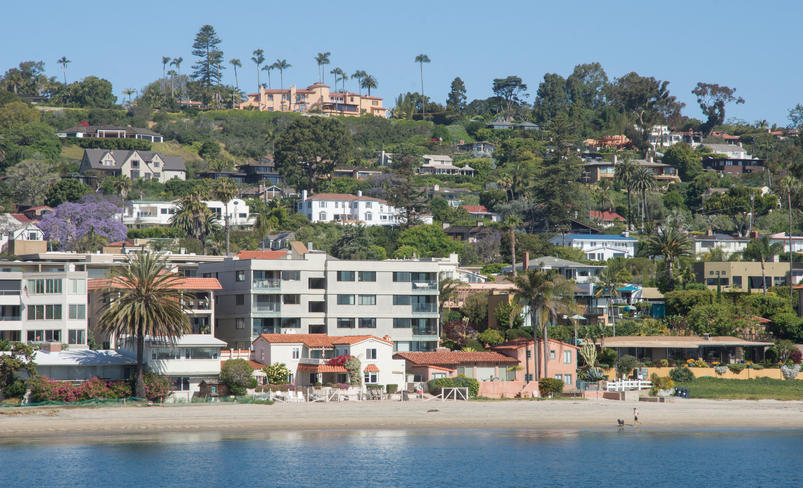
Photo Credit: Tim Brown / Alamy Stock Photo
8. San Diego, CA
- Homeownership rate (15 to 34 years old): 16.1%
- 5-year percent change: -13.9%
- Homeownership rate (all ages): 46.5%
- Millennial-owned households: 20,613 (out of 228,007 owner-occupied households)
- Average millennial home value: $434,938
- Average home value (all ages): $584,544
The millennial homeownership rate in San Diego is 16.1 percent. This is a 13.9 percent decrease from 2011. Average home values in San Diego are more than twice as high as the national averages: $434,938 for San Diego millennials and $584,544 for the overall San Diego population.
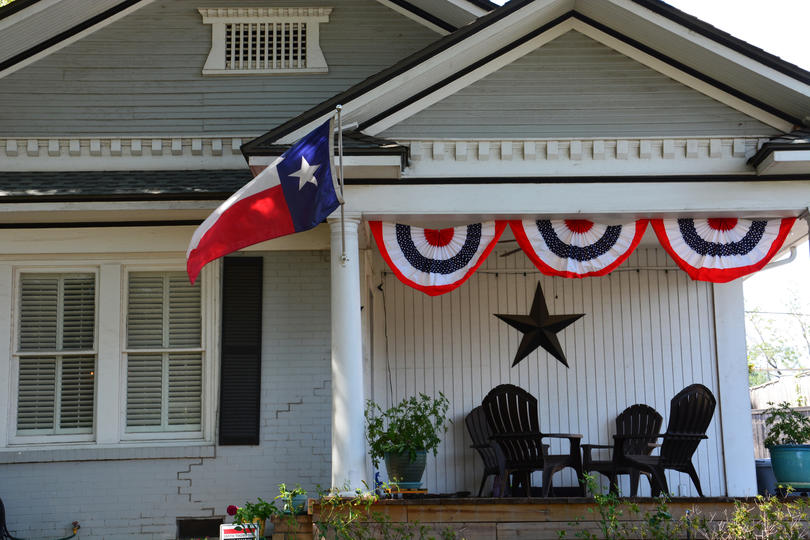
Photo Credit: D Guest Smith / Alamy Stock Photo
9. Dallas, TX
- Homeownership rate (15 to 34 years old): 15.2%
- 5-year percent change: -17.4%
- Homeownership rate (all ages): 41.9%
- Millennial-owned households: 22,365 (out of 204,302 owner-occupied households)
- Average millennial home value: $223,638
- Average home value (all ages): $259,456
Out of the Texas cities on the top 25 list, Dallas has the lowest millennial homeownership rate at 15.2 percent. The average millennial home value of $223,638 is slightly higher than the national average for this demographic, while the average home value for all ages ($259,456) is slightly lower than the overall national average. Millennials own 22,365 of 204,302 owner-occupied homes in Dallas.

Photo Credit: Marcelo Vinante / Alamy Stock Photo
10. San Jose, CA
- Homeownership rate (15 to 34 years old): 24.7%
- 5-year percent change: -16.8%
- Homeownership rate (all ages): 57.1%
- Millennial-owned households: 14,540 (out of 181,122 owner-occupied households)
- Average millennial home value: $581,434
- Average home value (all ages): $694,056
Nestled in the heart of Silicon Valley, San Jose is known for high salaries and attracting fresh tech talent, especially among millennials. San Jose’s millennial homeownership rate is 24.7 percent, the highest of all California cities on this list. Like the other California cities on this list, San Jose has some of the highest home values—the average millennial home value is $581,434.

Photo Credit: Eva Hawker / Alamy Stock Photo
11. Austin, TX
- Homeownership rate (15 to 34 years old): 17.1%
- 5-year percent change: -10.3%
- Homeownership rate (all ages): 45.3%
- Millennial-owned households: 20,930 (out of 162,271 owner-occupied households)
- Average millennial home value: $265,810
- Average home value (all ages): $330,355
Compared to other large cities on this list, Austin had a less dramatic decrease in homeownership for 15-34 year olds over the past five years—only 10.3 percent. In Austin, 17.1 percent of millennials own a home. Austin’s average millennial home value is $265,810, noticeably less than the $330,355 average home value for all ages.
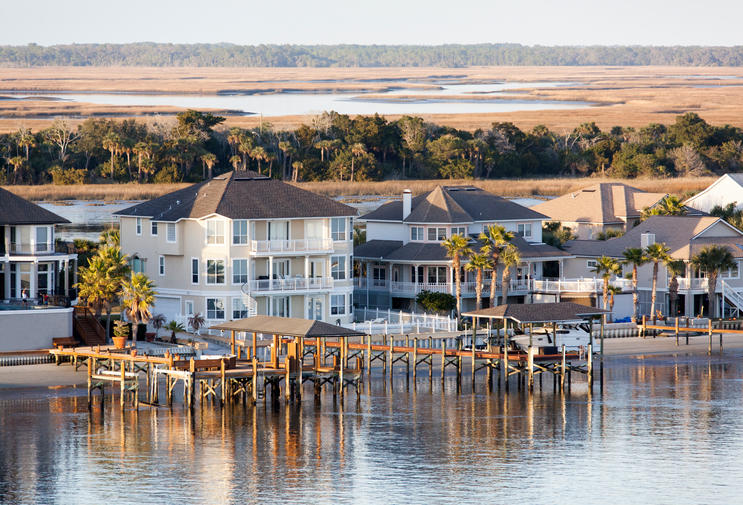
Photo Credit: Ramunas Bruzas / Alamy Stock Photo
12. Jacksonville, FL
- Homeownership rate (15 to 34 years old): 25.2%
- 5-year percent change: -28%
- Homeownership rate (all ages): 57.9%
- Millennial-owned households: 18,532 (out of 186,421 owner-occupied households)
- Average millennial home value: $169,883
- Average home value (all ages): $178,866
In Jacksonville, the percentage of millennials who own is 25.2 percent. About 1 in 10 homeowners in Jacksonville are millennials. The average millennial home value is $169,883, a little less than the $178,866 average for the entire city population.

Photo Credit: Sean Pavone / Alamy Stock Photo
13. San Francisco, CA
- Homeownership rate (15 to 34 years old): 11.7%
- 5-year percent change: No significant change
- Homeownership rate (all ages): 36.8%
- Millennial-owned households: 10,640 (out of 131,331 owner-occupied households)
- Average millennial home value: $939,941
- Average home value (all ages): $1,064,837
San Francisco has the lowest millennial homeownership rate on this list, at 11.7 percent. Correspondingly, San Francisco also has the lowest overall homeownership rate, at 36.8 percent. The average millennial home value in San Francisco is $939,941, while the overall city average is $1,064,837. Unlike most cities on this list, the millennial homeownership rate has not changed significantly over the past five years.

Photo Credit: Jessica Kirsh / Alamy Stock Photo
14. Indianapolis, IN
- Homeownership rate (15 to 34 years old): 25.9%
- 5-year percent change: -18%
- Homeownership rate (all ages): 53.0%
- Millennial-owned households: 23,090 (out of 175,630 owner-occupied households)
- Average millennial home value: $137,952
- Average home value (all ages): $151,314
In Indianapolis, 23,090 of households are owned by millennials. The millennial homeownership rate is 25.9 percent, and the average millennial home value is $137,952. From 2011 to 2016, there was an 18 percent decrease in homeownership among householders 15-34 years old.

Photo Credit: Harley Rouda / Alamy Stock Photo
15. Columbus, OH
- Homeownership rate (15 to 34 years old): 22.3%
- 5-year percent change: -15.8%
- Homeownership rate (all ages): 45.0%
- Millennial-owned households: 24,637 (out of 152,966 owner-occupied households)
- Average millennial home value: $151,812
- Average home value (all ages): $149,893
Columbus has a millennial homeownership rate of 22.3 percent, about 50 percent lower than the homeownership rate for all ages in the city. Unlike most of the cities on this list, the average millennial home value is higher than the average value for all ages: $151,812 vs $149,893. There are 24,637 households in Columbus that are owned by millennials.

Photo Credit: Paul Brady / Alamy Stock Photo
16. Fort Worth, TX
- Homeownership rate (15 to 34 years old): 32.5%
- 5-year percent change: -17%
- Homeownership rate (all ages): 56.7%
- Millennial-owned households: 24,121 (out of 158,379 owner-occupied households)
- Average millennial home value: $155,061
- Average home value (all ages): $169,995
The millennial homeownership rate in Fort Worth is 32.5 percent, the highest on this list and about the same as the national rate. The average millennial home value of $155,061 is slightly less than the overall average home value of $169,995. There was a 17 percent decrease in homeownership for 15-34 year olds from 2011 to 2016.
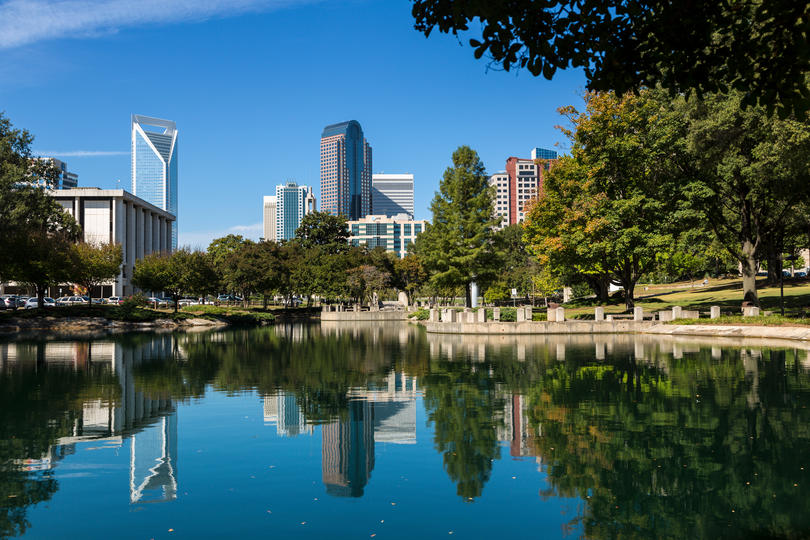
Photo Credit: Paul Thompson Images / Alamy Stock Photo
17. Charlotte, NC
- Homeownership rate (15 to 34 years old): 26.5%
- 5-year percent change: -26.1%
- Homeownership rate (all ages): 53.3%
- Millennial-owned households: 21,747 (out of 165,189 owner-occupied households)
- Average millennial home value: $206,863
- Average home value (all ages): $261,364
Millennials in Charlotte have a homeownership rate of 26.5 percent. Despite being one of the higher rates on this list, it is 26.1 percent less than it was in 2011. The average millennial home value is $206,863, which is close to the national average for millennials.
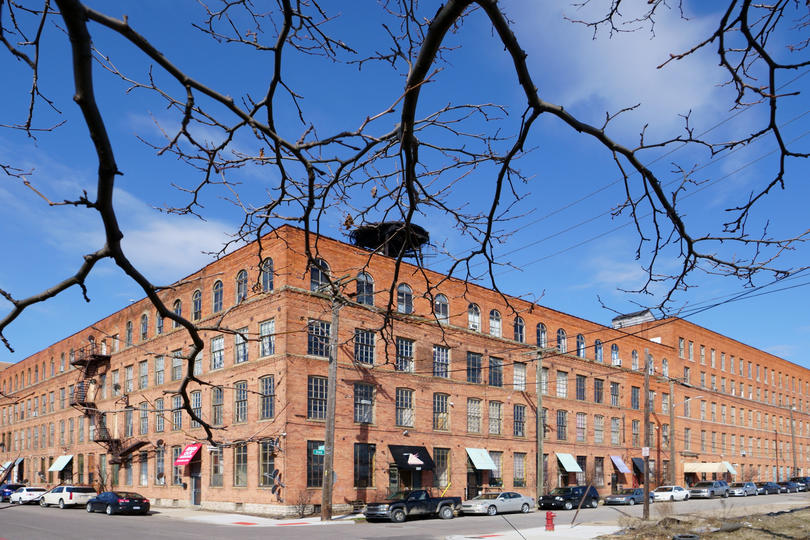
Photo Credit: Amoniak / Alamy Stock Photo
18. Detroit, MI
- Homeownership rate (15 to 34 years old): 22.6%
- 5-year percent change: -11.3%
- Homeownership rate (all ages): 48.2%
- Millennial-owned households: 11,313 (out of 123,808 owner-occupied households)
- Average millennial home value: $56,266
- Average home value (all ages): $62,114
In Detroit, 22.6 percent of millennials own a home. This represents an 11.3 percent decrease from 2011, nearly identical to the national change. Detroit has the lowest home values on this list. The average home value for millennials in Detroit is $56,266, while the average home value for all ages is $62,114.

Photo Credit: Paul Brady / Alamy Stock Photo
19. El Paso, TX
- Homeownership rate (15 to 34 years old): 28.3%
- 5-year percent change: -7.8%
- Homeownership rate (all ages): 59.2%
- Millennial-owned households: 13,709 (out of 131,205 owner-occupied households)
- Average millennial home value: $140,239
- Average home value (all ages): $141,966
At 28.3 percent, El Paso has the second-highest rate of millennial homeownership on this list. However, this is still lower than the 32.6 percent of millennial homeownership nationwide. The difference between millennial home values ($140,239) and average home values ($141,966) is negligible. The homeownership for 15-34 year olds over the past five years has declined by 7.8 percent, one of the smallest changes on this list.

Photo Credit: Jose Luis Stephens / Alamy Stock Photo
20. Seattle, WA
- Homeownership rate (15 to 34 years old): 16.4%
- 5-year percent change: -20.8%
- Homeownership rate (all ages): 46.2%
- Millennial-owned households: 15,769 (out of 140,436 owner-occupied households)
- Average millennial home value: $454,957
- Average home value (all ages): $566,076
The number of millennial-owned households in Seattle is 15,769, representing a homeownership rate of 16.4%. The average millennial home value in Seattle is $454,957, much lower than the overall city average of $566,076.
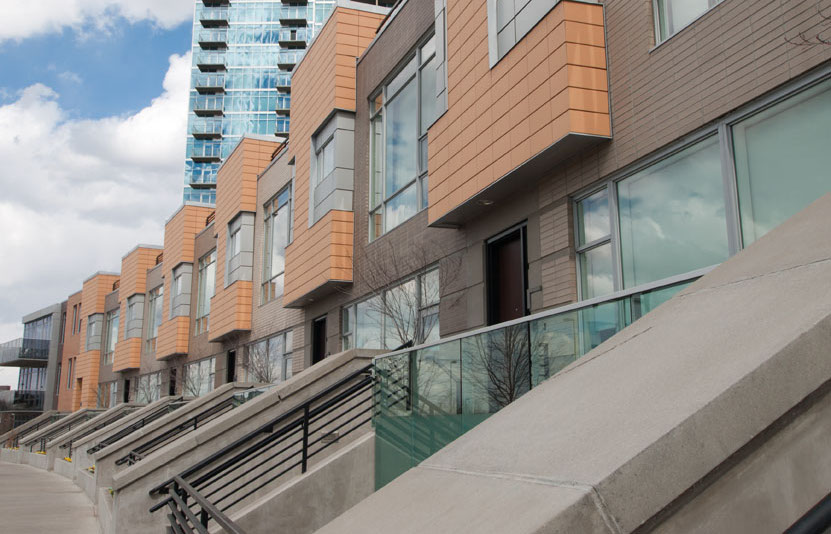
Photo Credit: Arina Habich / Alamy Stock Photo
21. Denver, CO
- Homeownership rate (15 to 34 years old): 24.8%
- 5-year percent change: -11.1%
- Homeownership rate (all ages): 49.4%
- Millennial-owned households: 21,333 (out of 138,870 owner-occupied households)
- Average millennial home value: $303,528
- Average home value (all ages): $361,354
In Denver, 24.8 percent of millennials own homes. This represents an 11.1 percent decrease from 2011. Nevertheless, about 15 percent of homeowners in Denver are millennials (21,333 out of 138,870), which is higher than most of the cities on this list.
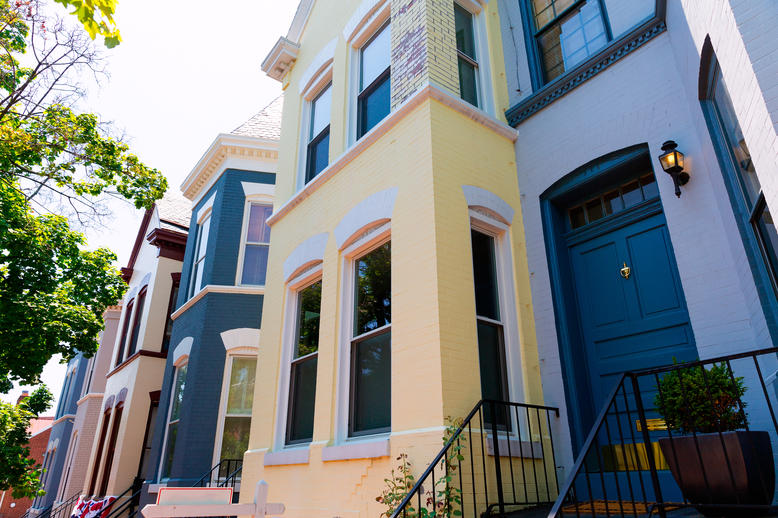
Photo Credit: NATUREWORLD / Alamy Stock Photo
22. Washington, DC
- Homeownership rate (15 to 34 years old): 17.2%
- 5-year percent change: -14.2%
- Homeownership rate (all ages): 40.7%
- Millennial-owned households: 13,979 (out of 112,672 owner-occupied households)
- Average millennial home value: $495,299
- Average home value (all ages): $631,762
In Washington D.C., the millennial homeownership rate is 17.2 percent. A total of 13,979 households in the city are owned by millennials. Average millennial home values in Washington D.C., at $495,299, are significantly lower than the overall average home value in the city, which is $631,762. However, these are also some of the most expensive housing prices on this list, behind California cities and New York.
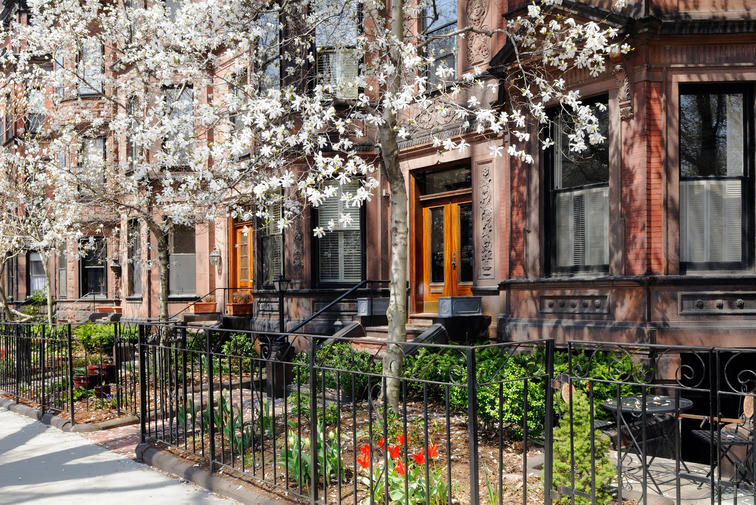
Photo Credit: Jorge Salcedo / Alamy Stock Photo
23. Boston, MA
- Homeownership rate (15 to 34 years old): 16.3%
- 5-year percent change: No significant change
- Homeownership rate (all ages): 34.7%
- Millennial-owned households: 14,093 (out of 89,882 owner-occupied households)
- Average millennial home value: $489,407
- Average home value (all ages): $551,621
Similar to the other Northeast cities on this list, Boston features high home values and relatively low homeownership rates. However, about 15.7 percent of all homeowners in Boston are millennials, higher than the national statistic. In Boston, the millennial homeownership rate is 16.3 percent. Like San Francisco, Boston has not had a significant change in homeownership for 15-34 year olds over the past five years.

Photo Credit: Sean Pavone / Alamy Stock Photo
24. Memphis, TN
- Homeownership rate (15 to 34 years old): 17.3%
- 5-year percent change: -30.2%
- Homeownership rate (all ages): 47.9%
- Millennial-owned households: 10,889 (out of 120,533 owner-occupied households)
- Average millennial home value: $132,496
- Average home value (all ages): $144,143
About 9 percent of the households in Memphis are owned by millennials, and 17.3 percent of millennials own their own home. Average home values in Memphis are significantly lower than the national average, with millennial homes in Memphis carrying a value of $132,496. Memphis suffered the largest decrease in homeownership among 15-34 year olds over the past five years—30.2 percent.

Photo Credit: Sean Pavone / Alamy Stock Photo
25. Nashville, TN
- Homeownership rate (15 to 34 years old): 26.9%
- 5-year percent change: -13%
- Homeownership rate (all ages): 53.5%
- Millennial-owned households: 20,200 (out of 138,890 owner-occupied households)
- Average millennial home value: $209,679
- Average home value (all ages): $231,291
In Nashville, 26.9 percent of millennials own their own homes. This is 50 percent lower than the overall homeownership rate in Nashville, which stands at 53.5 percent. The average millennial home value of $209,679 is similar to the national average.
Methodology
The data used in this analysis is from the U.S. Census Bureau 2016 American Community Survey 5-Year Estimates. The millennial homeownership rate is estimated as the number of owner-occupied housing units divided by the number of total housing units for all units where the householder is between 15 and 34 years old. The 5-year percent change in homeownership rate compares the homeownership rate for householders 15 to 34 years old in 2016 to the homeownership rate for householders 15 to 34 years old in 2011. Changes between 2011 and 2016 were tested for statistical significance. If the change is not statistically significant, “No change” is reported. Only the top 200 cities by total population were included in the analysis.
Haven Life Insurance Agency LLC (Haven Life) conducted this research for educational/informational purposes only. Haven Life is an online life insurance agency offering term life insurance issued by Massachusetts Mutual Life Insurance Company. Haven Life does not provide tax, legal, investment, or housing/real estate advice, and the information in the study should not be relied on as such. You should consult your own tax, legal, investment, and other advisors, as appropriate, before engaging in any transaction.
More From KMPT-AM


